POSTS
Data pipeline

Questions in, answers out.
Data pipeline is a collection of processes that transform raw data into actionable knowledge. It helps people work better together by giving them standardised answers to the questions they have.
What is the best way to reach new customers? Why did our sales go down last week? How big are we in Japan?
To answer these questions with confidence, I’ve found it useful to have a structured approach to data pipeline building.
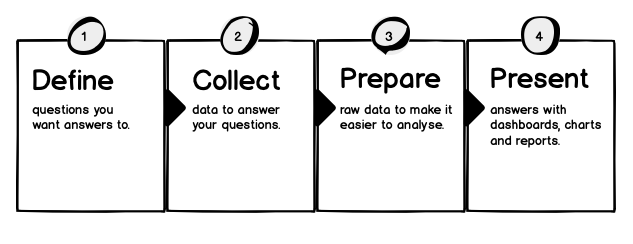
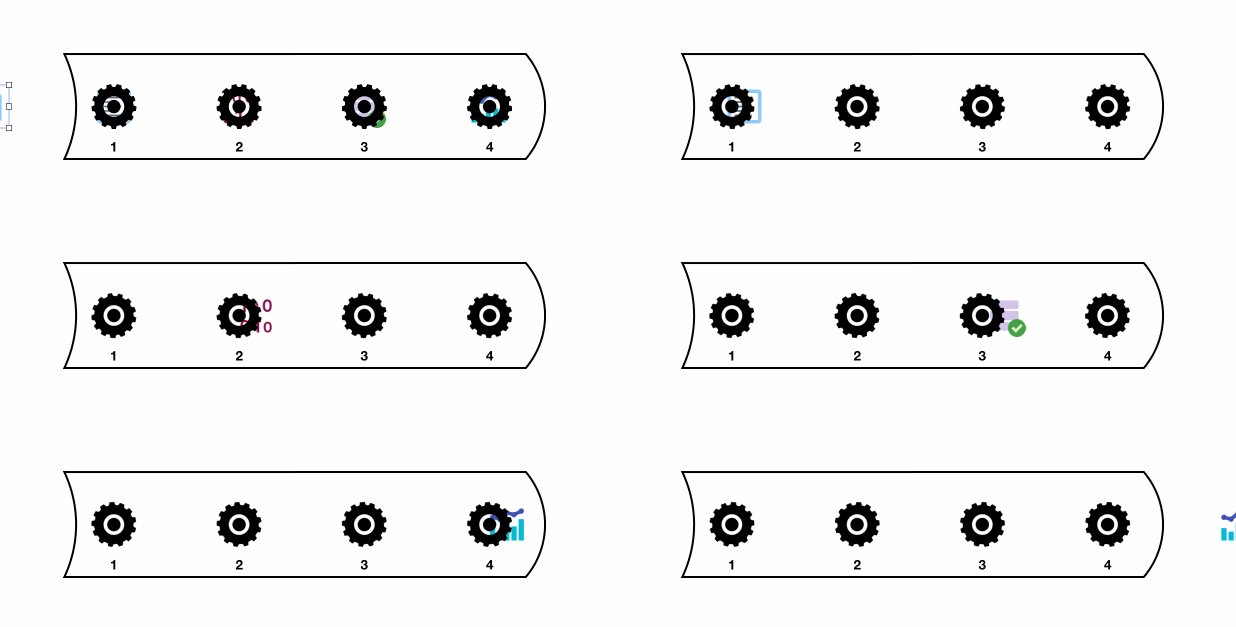
Define. Collect. Prepare. Present.
With this mantra in mind, we can go a bit deeper and divide each stage into concrete projects.
Define: Questions, designs, terms

Questions are the reason to collect data in the first place—there can’t be answers if there is no questions. One way to get a list of questions is to ask yourself and others: What do you need to know to do your job better?
Designs inform how questions are answered.
Is this a public dashboard? Is a line chart the best way to visualise this? Should we be able to group sales data per ZIP code, or will per city do?
With good designs, everyone knows what to expect.
Term definitions help you to avoid confusion when interpreting your data.
How do we define a new user? What is an order?
Collect: Documentation, collection, storage
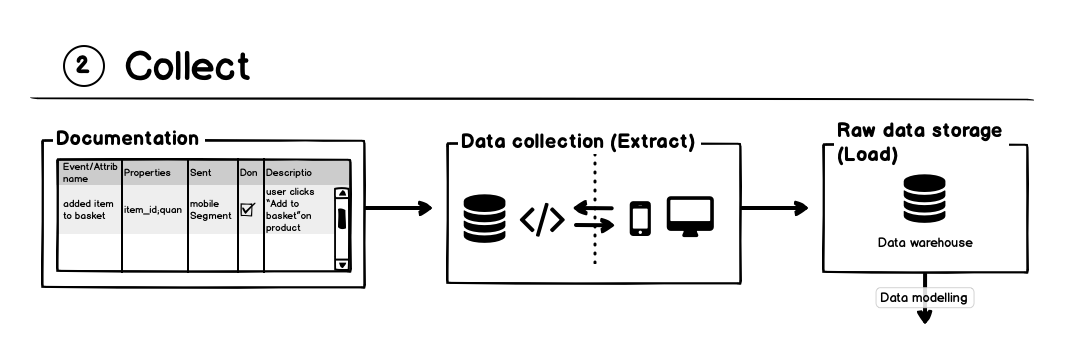
Documentation (sometimes data dictionary or taxonomy) is basically a list of data-points-to-be-collected from the various data sources you have.
Collection is the actual—you guessed it—collection of data. It’s done with software called connectors, which move data from its origin (e.g. your accounting software) into some storage for further analysis.
Storage is usually a data warehouse, which is used to store all your data in one place for easier future access.
Prepare: Transformation, structured storage
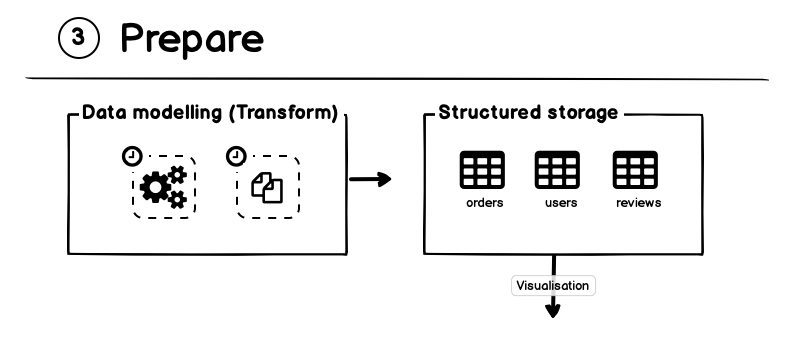
Transformation means making raw data ready for analysis. The technical term for this is data modelling.
Structured storage is where the transformed data lives. The data tables are constructed in a way that makes data analysis not only easy, but reliable.
Present: Analysis, answers
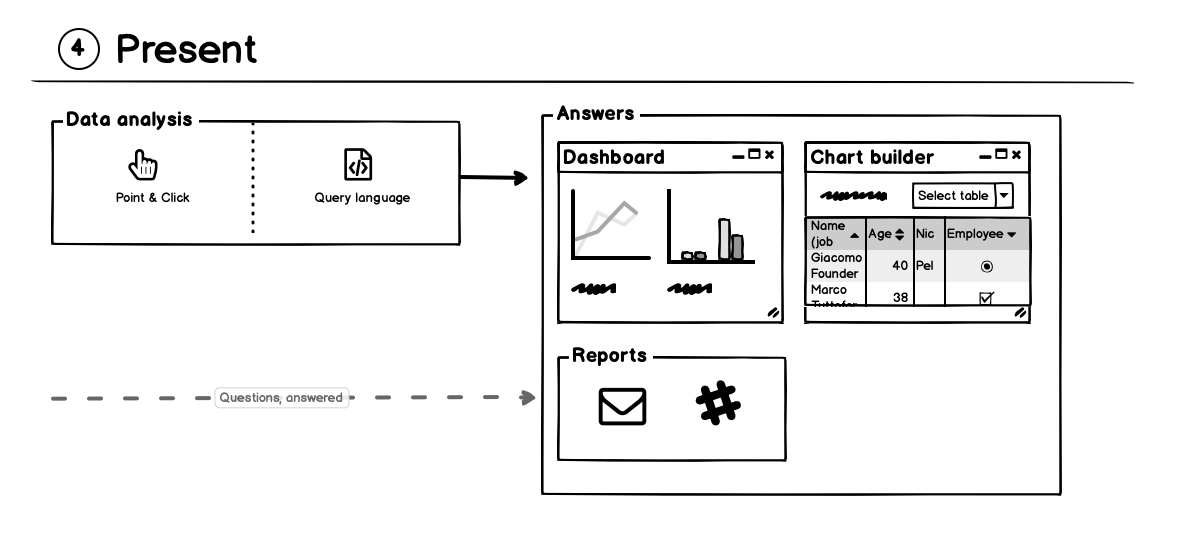
Analysis consists of exploring data with some data analysis tool and generating visual answers to people’s questions.
Answers are the dashboards, charts and reports coming out of the analysis phase. This is when most people interact with data after having questions.
Define. Collect. Prepare. Present.

1️⃣ Define questions you want answers to.
2️⃣ Collect data to answer your questions.
3️⃣ Prepare data to make it easier to analyse.
4️⃣ Present answers with dashboards, charts and reports.
Questions in, answers out.